Listen to what the product data was saying
B2B · UX Strategy · HR Technology
TOTVS · 2026
From Raw Data to Product Hypotheses
My Role
Throughout the project I was responsible for:
✓Proposing and leading the data exploration
✓Defining the guiding question and the analysis method
✓Cross-referencing five independent data sources
✓Synthesizing signals, patterns and diagnoses
✓Writing testable hypotheses and strategic theses
✓Presenting a prioritized discovery roadmap to Product leadership
Overview
This project was developed for a B2B SaaS platform that companies use to manage employee time tracking.
The product already generated a lot of data: NPS surveys, cancellation records, support tickets and usage sessions. But each source lived with a different team, and nobody was reading them together.
Instead of waiting for demands to arrive from stakeholders, I proposed an exploration of the existing data so that design could generate its own demands, grounded in what users were actually experiencing.
What motivated the investigation
Find real problems based on existing data
Position design as a generator of user-based demands
The Challenge
Guiding question
Which product problems are impacting the user experience and deserve investigation?
The challenge wasn't a lack of data. It was turning scattered, contradictory numbers into a clear and defensible reading of the product, one that Product leadership could act on.
Discovery
Five data sources, five questions
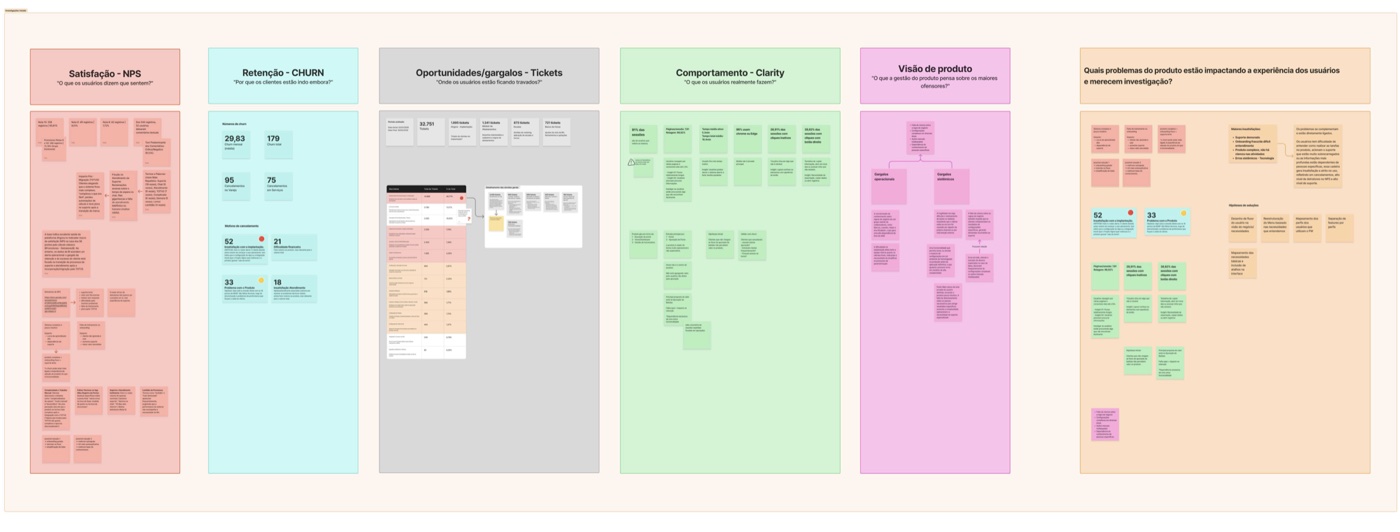
Each data source entered the process to answer a question of its own. Together, they covered what users say, what they do, why they leave, where they get stuck and what the company believes.
Satisfaction
NPS
What do users say they feel?
Scores and open comments from the last cycle
Retention
Churn
Why are customers leaving?
Cancellations and declared reasons
Bottlenecks
Tickets
Where are users getting stuck?
Volume and subject of support requests
Behavior
Clarity
What do users actually do?
Sessions, clicks and navigation flows
Internal view
Product management
What does leadership believe are the biggest offenders?
Operational and systemic bottlenecks
The Product management view was collected before cross-referencing the data, so it could work as a counterpoint instead of a bias.
Method
From raw data to thesis
To avoid jumping from a single number to a conclusion, I structured the analysis in six stages. Each stage reduced volume and increased confidence.
Evidence
Facts extracted from a single source
9
Signals
Evidence pointing to the same place
6
Patterns
Signals that combine across sources
3
Diagnoses
The consolidated reading of the problem
3
Hypotheses
Testable bets with an expected result
4
Theses
Strategic positions about the product
3
Evidence
What each source showed
Data from January to May 2026.
Retention
The size of churn
179
cancellations in the period
29.8
cancellations per month on average
Churn was split similarly between the two business segments, so the reason didn't seem to be the customer profile.
Four reasons account for most cancellations
5229%
Dissatisfaction with implementation
3318%
Problems with the product
2112%
Financial difficulty
1810%
Dissatisfaction with support
Together, implementation, product and support account for 103 of the 179 cancellations.
Satisfaction
The score is good. The comments are not.
56
product NPS
72.8%
promoters
61.5%
of comments have a predominantly critical or negative tone
Most repeated words in comments
Support18×Chat9×Service9×Complicated6×Delay5×Slowness4×
Bottlenecks
Where support tickets pile up
32,751 support requests analyzed in the period
45.8%
are configuration and setup questions
The product needs human support to be configured.
21.6%
are lost or abandoned conversations
4,500
chat tickets have no category
A signal source the analysis couldn't capture yet.
Behavior
Real usage sessions, without opinions in between
91%
of sessions are returning users: operational use, not exploratory
12.4 min
average time per session
96%
access through Chrome or Edge
28.9%
of sessions have dead clicks on elements that look like buttons but don't work
38.8%
of sessions have right-clicks: users trying to copy data or open a new tab
Home → Time-punch calculation
The main flow. The Home page adds no value: users go straight past it.
Internal view
The bottlenecks according to Product management
Operational bottlenecks
Overloaded support
Demand concentrated in a few people who know the business rules
Difficult onboarding and implementation
Initial configuration requires intensive hands-on support
Knowledge concentrated in four people
A human bottleneck in the support team
Systemic bottlenecks
A product that doesn't explain itself
The interface doesn't guide the user, so every action becomes a support request
Too many steps in each task
Long flows without a defined journey
Technology and platform
A perceived UX regression and loss of automations after the platform migration
Signals
Six signals detected
A signal appeared when evidence from different sources pointed to the same place.
S01High
High drop-off during implementation
52 of 179 cancellations happen before the customer reaches full use
S02High
Overloaded and hard-to-reach support
7,082 lost conversations and NPS dominated by complaints about delays and queues
S03High
Structural dependence on human support
45.8% of tickets are everyday configuration questions
S04Medium
Perceived regression after migration
Long-time users report a more complex product and worse support after the transition
S05Medium
Dependence on a single feature
Users who don't reach time-punch calculation rarely perceive value in the product
S06Medium
Confusing layout and no defined journey
Dead clicks, constant right-clicks and long flows without finding information
Patterns
Three convergence patterns
Combinations of signals that held up across independent sources.
Unmanaged complexity drives customers away before they reach value
Complex implementation, a product that doesn't explain itself and the lack of a defined journey converge: customers can't reach value without intensive help. Signals S01 + S03 + S06.
The support channel amplifies every product flaw
With support hard to reach, any friction that used to be solved quickly now turns into churn or NPS detraction. Signals S02 + S04.
The product retains those who activate, but fails to activate
91% of returning sessions show real value. But dependence on a single feature and a high entry barrier create a funnel with a bottleneck at activation. Signals S01 + S05.
Diagnoses
The consolidated reading of the problem
Before proposing any solution, the patterns were translated into three diagnoses.
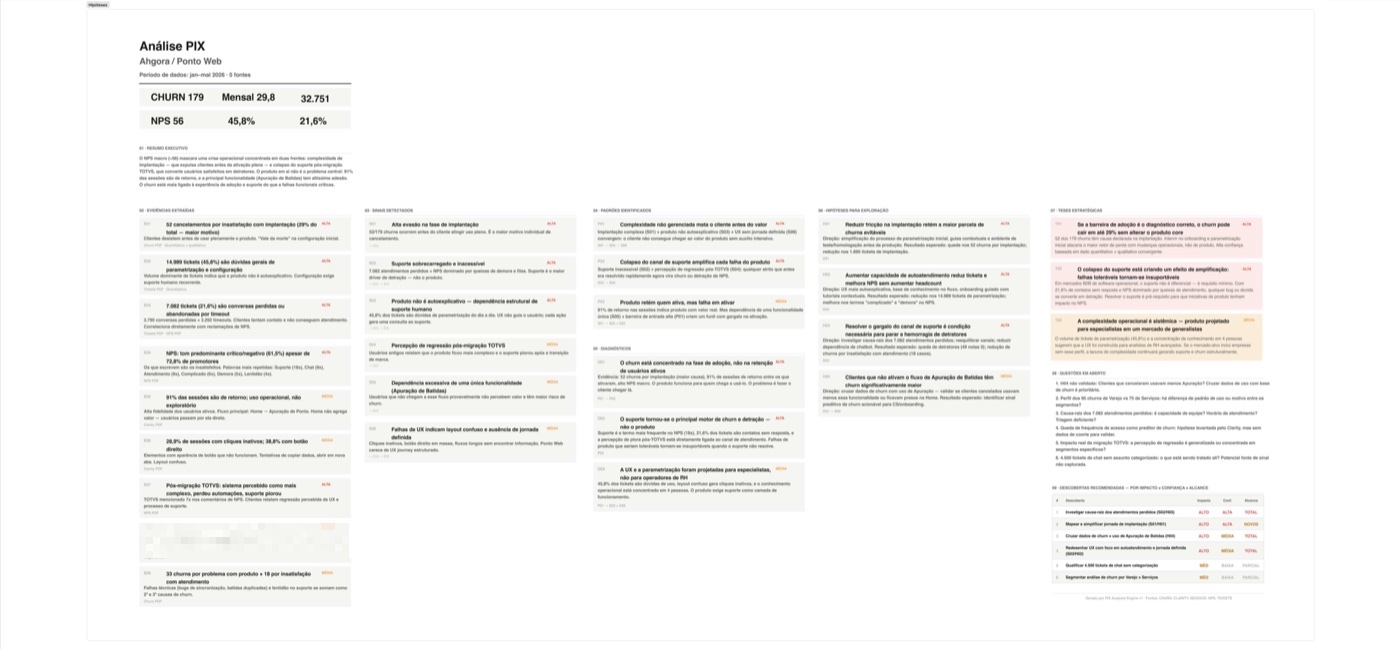
Churn is concentrated in adoption, not retention
52 cancellations due to implementation and 91% returning sessions among those who activated. The product works for those who get to use it. The problem is getting customers there.
Support has become the main driver of detraction
"Support" is the most frequent word in the NPS, 21.6% of tickets go unanswered, and the perceived decline after the migration is tied to the service channel, not the product.
The UX was designed for specialists, not for HR operators
45.8% of tickets are usage questions, the layout generates dead clicks, and operational knowledge is concentrated in four people.
Hypotheses
Four hypotheses to explore
Each one with a direction for investigation and an expected result.
H01High
Reducing implementation friction retains the largest share of avoidable churn
Simplify the initial configuration with contextual guidance and a test environment before production. Expected: fewer of the 52 implementation-related cancellations.
H02High
Self-service reduces tickets and improves NPS without increasing headcount
A more self-explanatory UX, a knowledge base inside the flow and guided onboarding. Expected: fewer of the 14,989 configuration tickets.
H03High
Fixing the support channel bottleneck stops detraction
Investigate the root cause of the 7,082 lost conversations and rebalance channels. Expected: fewer detractors and fewer of the 18 support-related cancellations.
H04Medium
Customers who don't activate time-punch calculation churn significantly more
Cross-reference churn data with feature usage. Expected: an actionable predictive signal for Customer Success and onboarding.
Strategic Theses
Positions that guide prioritization
If the adoption barrier is the right diagnosis, churn can drop by up to 29% without changing the core product
52 of 179 cancellations have implementation as their declared cause. Improving onboarding targets the biggest source of loss with operational changes.
Without working support, tolerable product flaws become unbearable
In operational B2B software, support isn't a differentiator: it's a minimum requirement. Fixing it is a prerequisite for product initiatives to have any impact on NPS.
Operational complexity is systemic: a specialist's product in a generalist's market
If the target market includes companies without that profile, the complexity gap will keep generating support requests and churn structurally.
Outcome
This project showed that design can do more than respond to requests: it can help set the product agenda. By reading five scattered data sources together, we turned a pile of numbers into three diagnoses, four testable hypotheses and a prioritized discovery roadmap.
One of the strongest findings was that the biggest driver of churn wasn't the product itself, but the path to reach it. That shifted the conversation from adding features to reducing friction in implementation, support and the first steps of use.